generativepy.formulas module
Categories: generativepy generative art
The formulas module provides the ability to display formatted mathematical equations.
The module converts latex format equations into bitmap images, with text of any required colour and a transparent background. The image can be displayed using the Image class, which allows positioning and scaling of the formula. It is also possible to use the Transform class to apply general transforms to the formula image.
The image will be tightly cropped to include just the marked pixels, with no border.
The module contains a single function:
rasterise_formula- convert a formula to an image.
rasterise_formula
Convert a formula to an image.
rasterise_formula(name, formula, color, dpi=600, packages=None)
| Parameter | Type | Description |
|---|---|---|
| name | string | A name for the image. This will be used as the file name for the generated PNG file. |
| formula | string | The latex formula. |
| color | Color | The colour of the text. |
| dpi | number | The nominal resolution of the image. This controls the size of image, see below. Optional, default 600. |
| packages | list of strings | List of Latex package names. If present, these names will be imported and can be used in the Latex formula. Optional, default no strings. |
Converts a Latex formula into a PNG image as described above.
The position gives the position of the top left of the axes in user coordinates. width and height give the size of the axes area, again in user coordinates.
The name parameter is used to name the output file, and also any temporary files created. It is best to use a unique name that is indicative of the content. The image file will be created in the current folder.
formula is the formula, in latex format. The example code shows a couple of example formulae.
color controls the colour of the text. The text is created on a transparent background.
dpi controls the resolution of the output image, and so indirectly the image size. This value corresponds to the dpi parameter of the dvipng utility.
The default value of 600 creates the formula using a text height of about 60 pixels. The exact size of the image depends on the formula used. The image is cropped tightly to the image area that includes the formula.
You can change the image size by altering the dpi value - a smaller number creates a smaller image, larger value creates a larger image. Since the scaling is applied to the vector data, it is always rendered at the best quality at any size.
You can also resize the image when it is drawn on the page, using the scale method of the Image class. This method can reduce the size of the formula with reasonable quality, but since it works on the bitmap data increasing the size will cause pixelation problems.
packages is an optional list of Latex packages. Any valid packages listed here will be imported into the Latex equation description so that they can be used in the formula.
The function returns a tuple:
(filename, (width, height))
Here, filename is the name of the output PNG file (in the current version this will always be "(width, height) gives the width and height of the image in pixels.
Example
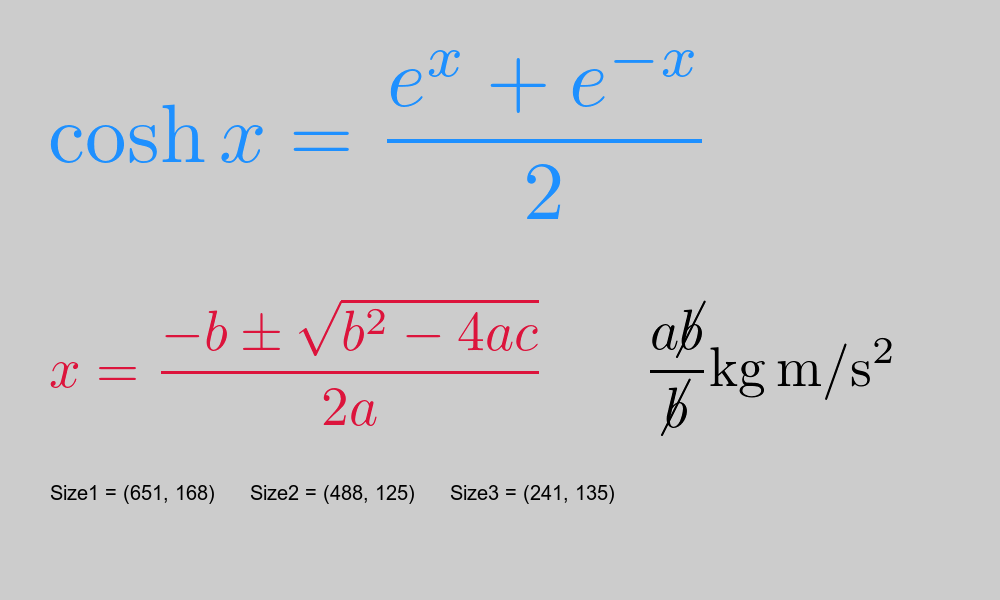
Here is an example that displays three formulae:
The code for this can be found on github as maths-formula.py:
from generativepy.drawing import make_image, setup
from generativepy.color import Color
from generativepy.geometry import Image, Text
from generativepy.formulas import rasterise_formula

'''
Create some formulae
'''

def draw(ctx, pixel_width, pixel_height, frame_no, frame_count):
    setup(ctx, pixel_width, pixel_height, background=Color(0.8))

    image1, size1 = rasterise_formula("cosh-formula", r"\cosh{x} = \frac{e^{x}+e^{-x}}{2}", Color("dodgerblue"))
    image2, size2 = rasterise_formula("quadratic", r"x=\frac{-b\pm\sqrt{b^2-4ac}}{2a}", Color("crimson"), dpi=400)
    image3, size3 = rasterise_formula("formula-test-temp", r"\frac{a\cancel{b}}{\cancel{b}}\si{kg.m/s^2}",
                                       Color("black"), dpi=400, packages=["cancel", "siunitx"])
    Image(ctx).of_file_position(image1, (50, 50)).paint()
    Text(ctx).of("Size1 = " + str(size1), (50, 500)).size(20).fill(Color(0))
    Image(ctx).of_file_position(image2, (50, 300)).paint()
    Text(ctx).of("Size2 = " + str(size2), (250, 500)).size(20).fill(Color(0))
    Image(ctx).of_file_position(image3, (650, 300)).paint()
    Text(ctx).of("Size3 = " + str(size3), (450, 500)).size(20).fill(Color(0))

make_image("/tmp/maths-formula.png", draw, 1000, 600)
image1 is a formula rendered in dodgerblue using default settings.
image2 is rendered in crimson, and uses a DPI of 400 so the formula is a bit smaller.
image3 is rendered in black, and illustrates the use of optional packages. It uses the Latex cancel package to draw the "cancel" lines through the variable b in the formula, and uses the siunitx package to render the units.
Related articles
- generativepy.analytics module
- generativepy.bitmap module
- generativepy.color module
- generativepy.drawing module
- generativepy.drawing3d module
- generativepy.geometry module
- generativepy.geometry3d module
- generativepy.gif module
- generativepy.graph module
- generativepy.math module
- generativepy.movie module
- generativepy.nparray module
- generativepy.shape2d module
- generativepy.table module
- generativepy.tween module
- generativepy.utils module
Join the GraphicMaths/PythonInformer Newsletter
Sign up using this form to receive an email when new content is added to the graphpicmaths or pythoninformer websites:
Popular tags
2d arrays abstract data type and angle animation arc array arrays bar chart bar style behavioural pattern bezier curve built-in function callable object chain circle classes close closure cmyk colour combinations comparison operator context context manager conversion count creational pattern data science data types decorator design pattern device space dictionary drawing duck typing efficiency ellipse else encryption enumerate fill filter for loop formula function function composition function plot functools game development generativepy tutorial generator geometry gif global variable greyscale higher order function hsl html image image processing imagesurface immutable object in operator index inner function input installing integer iter iterable iterator itertools join l system lambda function latex len lerp line line plot line style linear gradient linspace list list comprehension logical operator lru_cache magic method mandelbrot mandelbrot set map marker style matplotlib monad mutability named parameter numeric python numpy object open operator optimisation optional parameter or pandas path pattern permutations pie chart pil pillow polygon pong positional parameter print product programming paradigms programming techniques pure function python standard library range recipes rectangle recursion regular polygon repeat rgb rotation roundrect scaling scatter plot scipy sector segment sequence setup shape singleton slicing sound spirograph sprite square str stream string stroke structural pattern symmetric encryption template tex text tinkerbell fractal transform translation transparency triangle truthy value tuple turtle unpacking user space vectorisation webserver website while loop zip zip_longest