generativepy.graph module
Categories: generativepy generative art
The graph module provides the ability to draw graphs of mathematical functions. It can also be used in conjunction with the movie and tween modules to create animated graphs that can be converted to gifs or videos.
To draw a graph you must first create an Axes object that defines size, location, and scale of the graph axes. You can then create one or more Plot objects to draw the plots on the axes.
Graph scaling
Graph are drawn in the current user space. The size and location of the axes are defined in current user parameters.
The text and gridlines of the axes are designed for graphs that are a few hundred units wide. If you use graphs that are significantly larger or smaller than that, you might find that the axes text looks too big or small, and the grid lines might look too thick or thin. There are two ways of fixing this:
- Use the axes
with_feature_scalemethod. This scales all sizes and thicknesses up or down. So for example if your graph is 1000 units wide, you might want to apply a scale of around 2.0 to make the feature sizes proportionate to the graph size. - Alternatively, you can adjust all the features individually.
The second method allows you a great deal of control of the graph appearance. You can set the colours and styles of all the axis lines and text, and the background colour of the graph.
When you plot a curve:
- The curve line thickness, dash patterns etc are specified in user units.
- The curve points are mapped to the axis units (as you would expect, so that the curve appears in the right place on the graph).
Example
Here is an example graph drawn using the Axes object, and adding 3 curves:
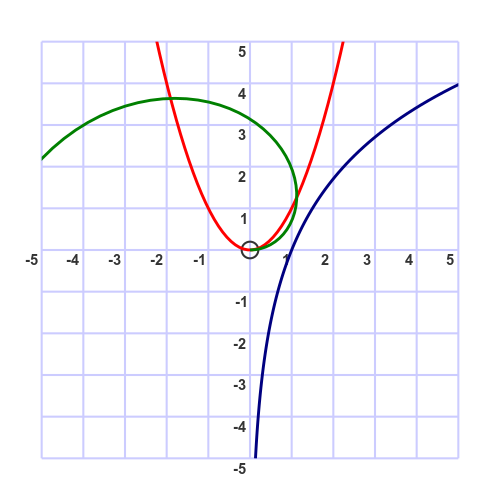
The code for this can be found on github as simplegraph.py:
from generativepy import graph
from generativepy.drawing import make_image, setup
from generativepy.color import Color
from generativepy.graph import Axes

'''
Create a simple graph
'''

def draw(ctx, width, height, frame_no, frame_count):

    setup(ctx, width, height, background=Color(1))

    # Creates a set of axes.
    # Use the default size of 10 units, but offset the start toplace the origin inthe centre
    axes = Axes(ctx, (50, 50), 500, 500).of_start((-5, -5))
    axes.draw()

    # Add various curves
    axes.clip()
    Plot(axes).of_function(lambda x: x * x).stroke(pattern=Color('red'))
    Plot(axes).of_xy_function(lambda x: 1.5 ** x).stroke(pattern=Color('green'))
    Plot(axes).of_polar_function(lambda x: 2 * x).stroke(pattern=Color('blue'))
    axes.unclip()

make_image("/tmp/simplegraph.png", draw, 500, 500)
Notice that we surround the Plot calls with axes.clip() and axes.unclip() to ensure that the curve is clipped to the area covered by the axes.
Axes
The Axes class draws graph axes, including the main axes, divisions, subdivisions, origin marker and division values. You simply need to create an Axes object then call draw to draw the axes.
Axes constructor
Creates an Axes object.
Axes(ctx, position, width, height)
| Parameter | Type | Description |
|---|---|---|
| ctx | Context | The Pycairo Context to draw to |
| position | (number, number) | A tuple of two numbers, giving the (x, y) position of the top left corner. |
| width | number | The width. |
| height | number | The height. |
Creates a set of axes for drawing a graph.
The position gives the position of the top left of the axes in user coordinates. width and height give the size of the axes area, again in user coordinates.
of_start
Sets the start of the axes values.
of_start(start)
| Parameter | Type | Description |
|---|---|---|
| start | 2-tuple | The (x, y) value of the bottom left corner of the graph in graph coordinates. |
Gives the start of the axes range. This represents the (x, y) value of the bottom left corner of the axes, in the coordinated of the graph itself.
If you wanted the graph to show x values in the range -1 to +5, and y values in the range -3 to +4, you would set a start of (-1, -3).
of_extent
Sets the extent of the axes values.
of_extent(extent)
| Parameter | Type | Description |
|---|---|---|
| extent | 2-tuple | The (x, y) of the axes in graph space. |
Gives the width and height of the axes range.
If you wanted the graph to show x values in the range -1 to +5, and y values in the range -3 to +3, you would set a extent of (6, 7). That is because the x axis has a range of 6 (from -1 to +5), and the y axis has a range of 7 (from -3 to +4).
with_feature_scale
Scales the graph features.
with_feature_scale(scale)
| Parameter | Type | Description |
|---|---|---|
| scale | number | The scale factor. |
Scales all the graph features by scale. This affects all the visible elements of the axes:
- The axis, division and sub-division line thicknesses will be scaled.
- The axis text will be scaled.
- The size of the axis ticks and origin marker.
For example, a scale of 2 will make these features twice as big, 0.5 will make them half as big.
The scale factor is applied on top of any changes made by the axes styling functions below. For example if you set the axis line width to 3, and apply a scale factor of 2, the axis line width will be drawn as 6 units.
with_divisions
Sets the division spacing.
with_divisions(divisions)
| Parameter | Type | Description |
|---|---|---|
| divisions | 2-tuple | The (x, y) division sizes. |
Sets the division spacing in the x and y directions. For example, (1, 5) will create an x division for every one unit in the axes space, and a y divison for every 5 units.
If this function isn't called, the divisions are set to (1, 1).
with_subdivisions
Sets the sub-division spacing.
with_subdivisions(divisions)
| Parameter | Type | Description |
|---|---|---|
| factor | 2-tuple | The (x, y) sub-division factor. |
Calling this method enables sub-divisions and sets the sub-division factor.
A factor of (5, 2) means that there will be 5 subdivisions per division on the x-axis, and y subdivisions per division on the y-axis.
If you do not call this function, no subdivisions will be shown.
background
Sets the background fill.
background(pattern)
| Parameter | Type | Description |
|---|---|---|
| pattern | Color or Pattern | The graph background pattern/colour. |
Sets the colour or pattern of the entire graph background. See the pattern parameter of the fill method of Shape.
text_color
Sets the text fill.
text_color(pattern)
| Parameter | Type | Description |
|---|---|---|
| pattern | Color or Pattern | The graph text pattern/colour. |
Sets the colour or pattern of the axis text. See the pattern parameter of the fill method of Shape.
If this function is not called, the text will be a dark grey colour.
text_style
Sets the text font and size for the axes text.
text_style(font="arial", weight=FONT_WEIGHT_BOLD, slant=FONT_SLANT_NORMAL, size=15)
| Parameter | Type | Description |
|---|---|---|
| font | string | Name of the font to use. |
| weight | enum | Font weight, default to normal. |
| slant | enum | Font slant, defalts to normal. |
| size | number | The size of the text. |
font is the name of the font, such as 'arial'.
weight is the font weight, either drawing.FONT_WEIGHT_NORMAL or drawing.FONT_WEIGHT_BOLD.
slant is the font slant, either drawing.FONT_SLANT_NORMAL, drawing.FONT_SLANT_ITALIC, or drawing.FONT_SLANT_OBLIQUE.
sizes sets the font size. This is approximately equal to the height of the font in user units. See the size method for Text objects.
If this method is not called, the font defaults to 'arial', bold, size 15.
axis_linestyle
Sets the line style of the graph axes.
axis_linestyle(pattern=Color(0), line_width=None, dash=None, cap=None, join=None, miter_limit=None)
| Parameter | Type | Description |
|---|---|---|
| pattern | Color or Pattern | The stroke pattern/colour. |
| line_width | number | The line width. |
| dash | array of numbers | The dash style. |
| cap | enum | The type of line cap. |
| join | enum | The type of line join. |
| miter_limit | number | The mitre limit. |
Sets the style of the main axis lines. See the stroke method of Shape.
If this function is not called, the line will be dark grey with a width of 2.
division_linestyle
Sets the line style of the graph axes.
division_linestyle(pattern=Color(0), line_width=None, dash=None, cap=None, join=None, miter_limit=None)
| Parameter | Type | Description |
|---|---|---|
| pattern | Color or Pattern | The stroke pattern/colour. |
| line_width | number | The line width. |
| dash | array of numbers | The dash style. |
| cap | enum | The type of line cap. |
| join | enum | The type of line join. |
| miter_limit | number | The mitre limit. |
Sets the style of the division lines. See the stroke method of Shape.
If this function is not called, the line will be light blue with a width of 2.
with_division_formatters
with_division_formatters(x_div_formatter=None, y_div_formatter=None)
| Parameter | Type | Description |
|---|---|---|
| x_div_formatter | Function | Formatter function |
| y_div_formatter | Function | Formatter function |
Override the text formatting for division labels and the x and y axes. For example:
- Instead of 1, 2, 3... you can override the labels to display π, 2π, 3π...
- Instead of -2, -1, 1, 2... you can override the labels to display [blank] -a, a, [blank]...
- Instead of 90, 180, 360... you can override the labels to display 90°, 180°, 270°...
The formatter function must have the signature:
formatter(value, div)
Here value is the value of the division, and div is the spacing between divisions. The function should return a string that will be displayed for that division. It can also be an empty string to display nothing for that division, which allows selected divisions to be unlabelled.
subdivision_linestyle
Sets the line style of the graph axes.
subdivision_linestyle(pattern=Color(0), line_width=None, dash=None, cap=None, join=None, miter_limit=None)
| Parameter | Type | Description |
|---|---|---|
| pattern | Color or Pattern | The stroke pattern/colour. |
| line_width | number | The line width. |
| dash | array of numbers | The dash style. |
| cap | enum | The type of line cap. |
| join | enum | The type of line join. |
| miter_limit | number | The mitre limit. |
Sets the style of the subdivision lines. See the stroke method of Shape.
If this function is not called, the line will be very light blue with a width of 2.
transform_from_graph
transform_from_graph(point)
| Parameter | Type | Description |
|---|---|---|
| point | (number, number) | Point in graph coordinates. |
Converts a point in graph coordinates to a point in user space coordinates. This is useful for placing text lables or other features relative to graph features.
Returns (x, y) coordinates in user space.
draw
Draws the axes using the Context supplied in the Axes constructor.
draw()
clip
Establishes a clipping path that covers the area of the axes. Anything drawn while the clip path is active will be clipped to the axes area.
clip()
unclip
Removes a clipping path previously set up by clip().
unclip()
Plot
The Plot class can draw various types of curve:
of_functionfor plotting functions of the form y = f(x).of_xy_functionfor plotting inverse functions of the form x = f(y).of_polar_functionfor plotting polar functions of the form r = f(a).
A Plot is a Shape object.
To draw a plot:
- Create a
Plotobject. - Call
of_functionor one of the other plotting method to define the curve. - Call the
strokefunction to draw the curve.
In most cases you will probably wish to clip the plot to the area covered by the axes. This is not done automatically, but it can be achieved by calling axes.clip() before using the Plot object, then calling axes.unlcip() after. See the example code above.
Plot constructor
Creates a Plot object.
Plot(axes)
| Parameter | Type | Description |
|---|---|---|
| axes | Axes | The Axes object the plot will be drawn against. |
of_function
Plots a function of the form y = f(x)
of_function(fn, extent=None, precision=100)
| Parameter | Type | Description |
|---|---|---|
| fn | function | A Python function that takes a single number parameter and returns a number. |
| extent | 2-tuple | The range of x values. |
| precision | int | The number of points to plot. |
If the extent is not supplied, the graph will be plotted for values of x that cover the full range of the axes. The extent can be used to limit the range to less than the full extent of the axes.
The precision determines how many points are used to draw the graph. If the number is set too low, the graph won't look smooth.
of_xy_function
Plots a function of the form x = f(y)
of_xy_function(fn, extent=None, precision=100)
| Parameter | Type | Description |
|---|---|---|
| fn | function | A Python function that takes a single number parameter and returns a number. |
| extent | 2-tuple | The range of y values. |
| precision | int | The number of points to plot. |
If the extent is not supplied, the graph will be plotted for values of y that cover the full range of the axes. The extent can be used to limit the range to less than the full extent of the axes.
The precision determines how many points are used to draw the graph. If the number is set too low, the graph won't look smooth.
of_polar_function
Plots a function of the form r = f(theta)
of_polar_function(fn, extent=None, precision=100)
| Parameter | Type | Description |
|---|---|---|
| fn | function | A Python function that takes a single number parameter and returns a number. |
| extent | 2-tuple | The range of theta values. |
| precision | int | The number of points to plot. |
If the extent is not supplied, the graph will be plotted for values of theta from 0 to 2*pi. The extent can be used to alter that range.
The precision determines how many points are used to draw the graph. If the number is set too low, the graph won't look smooth.
stroke
The stroke method of Plot has the same parameters as the stroke method of Shape. It will draw the shape defined by the supplied function.
The default line_width of the stroke for Plot is 2 (rather than 1 that is the default for most shapes).
Related articles
- generativepy.analytics module
- generativepy.bitmap module
- generativepy.color module
- generativepy.drawing module
- generativepy.drawing3d module
- generativepy.formulas module
- generativepy.geometry module
- generativepy.geometry3d module
- generativepy.gif module
- generativepy.math module
- generativepy.movie module
- generativepy.nparray module
- generativepy.shape2d module
- generativepy.table module
- generativepy.tween module
- generativepy.utils module
Join the GraphicMaths/PythonInformer Newsletter
Sign up using this form to receive an email when new content is added to the graphpicmaths or pythoninformer websites:
Popular tags
2d arrays abstract data type and angle animation arc array arrays bar chart bar style behavioural pattern bezier curve built-in function callable object chain circle classes close closure cmyk colour combinations comparison operator context context manager conversion count creational pattern data science data types decorator design pattern device space dictionary drawing duck typing efficiency ellipse else encryption enumerate fill filter for loop formula function function composition function plot functools game development generativepy tutorial generator geometry gif global variable greyscale higher order function hsl html image image processing imagesurface immutable object in operator index inner function input installing integer iter iterable iterator itertools join l system lambda function latex len lerp line line plot line style linear gradient linspace list list comprehension logical operator lru_cache magic method mandelbrot mandelbrot set map marker style matplotlib monad mutability named parameter numeric python numpy object open operator optimisation optional parameter or pandas path pattern permutations pie chart pil pillow polygon pong positional parameter print product programming paradigms programming techniques pure function python standard library range recipes rectangle recursion regular polygon repeat rgb rotation roundrect scaling scatter plot scipy sector segment sequence setup shape singleton slicing sound spirograph sprite square str stream string stroke structural pattern symmetric encryption template tex text tinkerbell fractal transform translation transparency triangle truthy value tuple turtle unpacking user space vectorisation webserver website while loop zip zip_longest