Mandelbrot fractal
Categories: graphics projects pillow numpy
The Mandelbrot set is a famous fractal that can be implimented quite easily in Python. We will use a numpy array to create the image pixels, then save the image using the technique described here.
What is the Mandelbrot set?
The Mandelbrot set is defined by the following equation:
xnext = x*x - y*y + c1
ynext = 2*x*y + c2
Starting from an initial value of x and y, and two constant values c1 and c2, we can calculate two new values, xnext and ynext.
Iteration
The next key ingredient of the Mandelbrot set is iteration. After calculating the new values of x and y, we feed them back into the equation and run the calculation again, over and over. Here is a Python loop that performs the calculation. The loop starts with x and y set to zero, and prints out the new value after each loop. We stop after 10 cycles:
def calc(c1, c2):
    x = y = 0
    for i in range(10):
        xnext = x*x - y*y + c1
        ynext = 2*x*y + c2
        x = xnext
        y = ynext
        print(x, y)
Now if we try calling this function with initial values of, for example c1 = 0.2 and c2 = 0.1, the sequence of values looks like this:
0.2 0.1
0.23 0.14
0.2333 0.16440000000000002
0.22740153000000002 0.17670904
0.22048537102861931 0.18036781212166242
0.21608125118807261 0.17953692795453008
0.21445759861565283 0.17758912805375543
0.21445416320109933 0.1761706758853121
0.21495448107239606 0.1755610697551134
0.2153837397195433 0.17547527729145027
After a few loops, the values kind of stabilise - they converge. If we try slightly different numbers, such as c1 = 0.5 and c2 = 1.0, we get something very different:
0.5 0.01
0.7499 0.02
1.06195001 0.039996000000000004
1.6261381437230003 0.09494750519992001
3.135310233727196 0.31879551971385567
10.228539678324857 2.0090457108504634
101.08675928277933 41.10920753800466
8529.065957891833 8311.20313340019
3668869.0894282013 141773599.43841496
-2.0086292897328776e+16 1040297553353152.1
The numbers get very big, very quickly - they diverge.
The Mandelbrot set
If we try this experiment with lots of different values for c1 and c2, we find that some values converge and some diverge. We could make a plot, representing each pair of values by the pixel at point (c1, c2). We could make the pixel black if the pair converges, and white if it diverges. The converging points are called the Mandelbrot set.
Since the equations are so simple, you might expect the shape created by the black pixels to also be simple - a circle or something. But in fact the shape is incredibly intricate, the edge of the shape is so complex that you can zoom in on it forever and never run out of finer and finer detail.
To plot this shape, we will first tidy up our calc function:
def calc(c1, c2):
    x = y = 0
    for i in range(1000):
        x, y = x*x - y*y + c1, 2*x*y + c2
        if x*x + y*y > 4:
            return i+1
    return 0
Here we have:
- used tuple unpacking to get rid of
xtempandytemp(we calculatexandyat the same time) - increased the loop count to 1000
- introduced a check that if
x*x + y*yever gets bigger than 4 we return early (oncexandyget bigger than that, they are never coming back down again)
We return 0 if the loop finishes (ie if the function converges, which means the point is in the set), and none zero if the function diverges.
Plotting the image
We are going to use a numpy array to hold our image as we create it. Each element of the numpy array holds the colour value of one pixel.
It turns out that the interesting part of the Mandelbrot set is in a a region that is 3 units square, with its bottom corner at (-2, -1.5). In other words, x values between -2 and +1, and y values between -1.5 and +1.5. We would like to create an image 600 pixels square that represents this region:
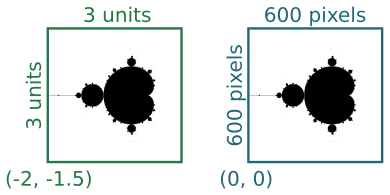
The two squares represent the same region, measured in different coordinate spaces We call the first set (the 3 by 3 square) our user space, and the second set (the 600 by 600 square) our pixel space.
To create the image we need to look at every pixel, and calculate whether it is in the set or not. To do this we need to convert the pixel coordinates into user space, because these are the numbers (c1 and c2) we need to plug into our loop to do the calculation.
We define our user space using the size and start position, like this:
WIDTH = 3
HEIGHT = 3
XSTART = -2
YSTART = -1.5
To define our pixel space, we simply define a scaling factor. A PIXEL_SCALING of 200 means 3 units in user space maps onto 600 pixels in pixel space:
PIXEL_SCALE = 200
To convert a pixel position (i, j) in pixel space, into user space values c1 and c2, we do the following scaling:
c1 = XSTART + i/PIXEL_SCALE
c2 = YSTART + j/PIXEL_SCALE
The great thing about this is, if we want a more detailed image, we only have to alter the PIXEL_SCALING. For example if we change it to to 1000 our image will show the same region but at 3000 pixels resolution (but it might take a while to run).
The main loop
Now we are in a position to write our main loop. First we create our numpy array, initially filled with zeros (black pixels). Here is how we create it:
image_width = int(PIXEL_SCALE*WIDTH)
image_height = int(PIXEL_SCALE*HEIGHT)

array = np.zeros((image_height,
                  image_width,
                  3),
                 dtype=np.uint8)
The array has 3 dimensions. The first is the height, or image y axis (numpy arrays conventionally store data in row, column order rather than x, y order). The image height is pixels is the height in user space multiplied by the pixel scale (giving 600). The second dimension is the width, or x axis, which is calculated similarly. Finally, for an RGB image every pixel has 3 values (red, green and blue) so our array required a third dimension (depth) of 3. Each element of the array is an 8 bit unigned int (a byte) which cans store a value in the range 0 to 255.
Now we loop over the every pixel (i, j) in the image and do the following:
- Convert
iandjto user space valuesc1andc2 - Call
calcto check if the point is inside the Mandelbrot set - If it is not in the set, make the pixel white, otherwise leave it black
Here is the code:
for i in range(image_width):
    c1 = XSTART + i/PIXEL_SCALE
    for j in range(image_height):
        c2 = YSTART + j/PIXEL_SCALE
        v = calc(c1, c2)
        if v:
            array[j, i,] = (255, 255, 255)
Finally, we convert the numpy array to an image and store it as a PNG file (as described here).
img = Image.fromarray(array)
img.save('mandelbrot.png')
Giving this image:

Here is the full code:
import numpy as np
from PIL import Image

PIXEL_SCALE = 200
WIDTH = 3
HEIGHT = 3
XSTART = -2
YSTART = -1.5

image_width = int(PIXEL_SCALE*WIDTH)
image_height = int(PIXEL_SCALE*HEIGHT)

def calc(c1, c2):
    x = y = 0
    for i in range(1000):
        x, y = x*x - y*y + c1, 2*x*y + c2
        if x*x + y*y > 4:
            return i+1
    return 0

array = np.zeros((image_height,
                  image_width,
                  3),
                 dtype=np.uint8)

for i in range(image_width):
    c1 = XSTART + i/PIXEL_SCALE
    for j in range(image_height):
        c2 = YSTART + j/PIXEL_SCALE
        v = calc(c1, c2)
        if v:
            array[j, i,] = (255, 255, 255)

img = Image.fromarray(array)
img.save('mandelbrot.png')
Adding some colour
The calc function doesn't just return a true or false value. It actually returns:
- zero (ie false) is the point is insde the set
- otherwise, it reurns a count of how many times the loop executes before the value of
x*x + y*yexceeds 4 (the point of no return)
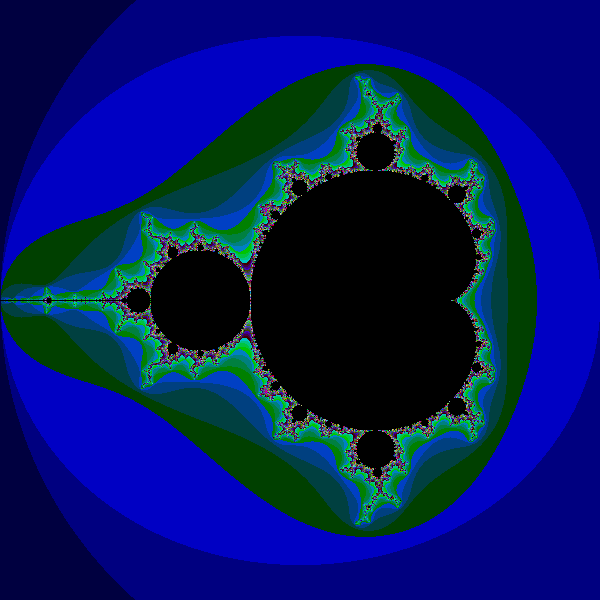
As you might expect, points that are a long way outside the boundary of the set tend to escape very quickly. Points that are very close to the boundary take longer to escape. So we can create a bit of extra interest in our image by setting the colour of the pixels outside the image according to the value returned by calc.
Here is a simple colour function that creates a color based on the escape number:
def create_color(v):
    values = [0, 64, 128, 196]
    b = values[v % 4]
    g = values[(v//4) % 4]
    r = values[(v//16) % 4]
    return (r, g, b)
As it happens, this function returns black if the value is 0, so we can replace this code in our original loop:
        if v:
            array[j, i,] = (255, 255, 255)
with this:
array[j, i,] = create_color(v)
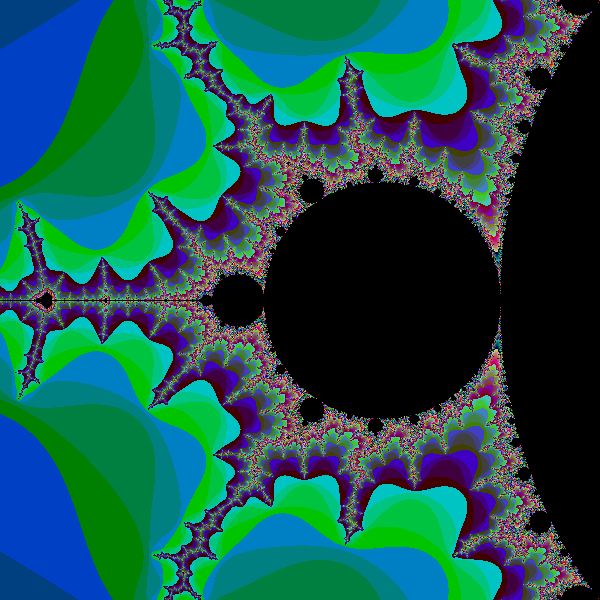
Giving this image:
Here is the full code:
import numpy as np
from PIL import Image

PIXEL_SCALE = 200
WIDTH = 3
HEIGHT = 3
XSTART = -2
YSTART = -1.5

image_width = int(PIXEL_SCALE*WIDTH)
image_height = int(PIXEL_SCALE*HEIGHT)

def create_color(v):
    values = [0, 64, 128, 196]
    b = values[v % 4]
    g = values[(v//4) % 4]
    r = values[(v//16) % 4]
    return (r, g, b)


def calc(c1, c2):
    x = y = 0
    for i in range(1000):
        x, y = x*x - y*y + c1, 2*x*y + c2
        if x*x + y*y > 4:
            return i+1
    return 0

array = np.zeros((image_height,
                  image_width,
                  3),
                 dtype=np.uint8)

for i in range(image_width):
    c1 = XSTART + i/PIXEL_SCALE
    for j in range(image_height):
        c2 = YSTART + j/PIXEL_SCALE
        v = calc(c1, c2)
        array[j, i,] = create_color(v)

img = Image.fromarray(array)
img.save('mandelbrot-colour.png')
Zooming in
You can zoom in on a part of the image by altering the parameters. Notice that, since WIDTH and HEIGHT are smaller, we needed to increase PIXEL_SCALE to keep the same image size (0.3*2000 is 600 pixels):
PIXEL_SCALE = 2000
WIDTH = .3
HEIGHT = .3
XSTART = -1.5
YSTART = -.15
This creates an image of the small bulb to the left of the main cardoid shape. You can see that this bulb itself has other smaller bulbs around it, and they too have their own even smaller bulbs. The detail goes on forever.
Things to try
Here are a few things to try:
- Experiment with other colour schemes
- Create a super high res image by increasing
PIXEL_SCALEwhile keepingWIDTHandHEIGHTthe same. Be aware that each time you double the pixel size the image will take about 4 times longer to create. - Try zooming in on some other areas
For a more ambitious project, try using Tkinter, Pygame or similar to create an interactive fractal explorer where you can select parts of the fractal with the mouse and zoom in deeper.
Join the GraphicMaths/PythonInformer Newsletter
Sign up using this form to receive an email when new content is added to the graphpicmaths or pythoninformer websites:
Popular tags
2d arrays abstract data type and angle animation arc array arrays bar chart bar style behavioural pattern bezier curve built-in function callable object chain circle classes close closure cmyk colour combinations comparison operator context context manager conversion count creational pattern data science data types decorator design pattern device space dictionary drawing duck typing efficiency ellipse else encryption enumerate fill filter for loop formula function function composition function plot functools game development generativepy tutorial generator geometry gif global variable greyscale higher order function hsl html image image processing imagesurface immutable object in operator index inner function input installing integer iter iterable iterator itertools join l system lambda function latex len lerp line line plot line style linear gradient linspace list list comprehension logical operator lru_cache magic method mandelbrot mandelbrot set map marker style matplotlib monad mutability named parameter numeric python numpy object open operator optimisation optional parameter or pandas path pattern permutations pie chart pil pillow polygon pong positional parameter print product programming paradigms programming techniques pure function python standard library range recipes rectangle recursion regular polygon repeat rgb rotation roundrect scaling scatter plot scipy sector segment sequence setup shape singleton slicing sound spirograph sprite square str stream string stroke structural pattern symmetric encryption template tex text tinkerbell fractal transform translation transparency triangle truthy value tuple turtle unpacking user space vectorisation webserver website while loop zip zip_longest